Master the Art of Excel Dashboards
Build stunning, interactive, professional dashboards that will impress your boss with our hands-on dashboard pack exercises that make learning fun and effective!


Struggling to Build Effective Dashboards?
Does this sound familiar?
Your reports feel stale and uninspired.
You’re overwhelmed and unsure where to start with Excel dashboards.
You waste time every month recreating the same reports manually.
You dream of making dashboards that are dynamic, but can’t figure out how.
It’s frustrating to know Excel has so much potential for presenting data beautifully, yet feel stuck trying to figure it all out on your own.
Imagine being able to create professional dashboards quicker, with your audience immediately understanding the insights without confusion. Why keep struggling?
It’s time to learn the skills that make dashboard creation effective, efficient, and enjoyable.

The Formula for Success!

I've been there before. At the start of my career I struggled through Excel just like you and made plenty of mistakes along the way.
But I realized Excel could be the key to my success if I could master this tool.
Hello, I'm John MacDougall, Microsoft MVP and expert in Excel with years of experience helping professionals like you demystify advanced Excel features. I'm here to guide you in your journey to Excel proficiency.
This set of dashboard practise files offers practical, step-by-step instructions to help you go from raw data to polished interactive dashboards.
But here’s the truth:
You don’t need to be an some sort of Excel wizard to create beautiful dashboards. You just need practice.
What You Will Learn
This dashboard pack take you step by step through building dashboards to strengthen your Excel skills with every click.
📁 Dashboard 1: Oakland City Call Center
📖 The Scenario: You’re a data analyst for Oakland City’s Call Center and your manager wants you to summarize the city's service request activities.
You’ve been asked to create a dashboard that can easily be updated each month and includes the following.
KPIs that show basic request stats.
The trend of new requests per month.
A breakdown of requests by source.
The top 10 requests.
A snapshot of closed vs other requests.
📁 Dashboard 2: Contoso Sales
📖 The Scenario: Contoso Ltd. is a growing global retail company. They sell a wide range of consumer electronics and accessories under various brands across North America and Europe.
To optimize their strategy, Contoso’s management has asked the Business Intelligence (BI) team to build an interactive sales dashboard using Excel. This dashboard should help monitor:
Regional and product-level performance.
Sales trends over time.
Delivery performance for online orders.
Profitability by brand, category, and sales segment.


📁 Dashboard 3: NYC Property Sales
📖 The Scenario: You’re working at Borough Insights, a New York city real estate consultancy.
Your manager has asked you to create a compelling, interactive dashboard to present to stakeholders.
Show overall sales metrics.
Show residential vs commercial sales.
Show month over month price changes.
Compare top and bottom neighborhoods.
Step by Step Instructions
Dive into engaging challenges that take you from beginner to confident dashboard creator.
Exercise Files: Raw data and detailed instructions to guide each step.
Solution Files: Finished dashboard example to compare your work and improve where needed.
Built-in Variety: Each challenge is unique, helping you solve different problems, stay engaged, and expand your skills.
You’ll gain the skills to build an interactive dashboard that not only looks amazing but also delivers impactful insights.

Dashboard Template Pack
💵 Only $27 USD
📁 3 Practise Files & 3 Solution Files
🔓 Lifetime Access
Exclusive Bonuses!
🔓 Enroll and unlock access to these invaluable bonuses for FREE!
🎁 Bonus 1: Revenue by Category KPI ($9 Value)
🎁 Bonus 2: CY vs PY KPI ($9 Value)
🎁 Bonus 3: CY vs PY Target KPI ($9 Value)
🎁 Bonus 4: Guage Chart KPI ($9 Value)
🎁 Bonus 5: Headcount KPI ($9 Value)
🎁 Bonus 6: Company Count KPI ($9 Value)
🎁 Bonus 7: Star Review KPI ($9 Value)
🎁 Bonus 8: Video Solution 🎥 ($27 Value)
Total Bonus Value: $90 USD
What Our Students Are Saying
Trusted by employees at these prestigious companies.


Step by Step Instructions
Dive into engaging challenges that take you from beginner to confident dashboard creator.


Grant M.
Financial Analyst
Clear and concise
I found this course interesting. I absolutely love how the instructor gives a clear and concise explanation of the Excel features to make working on Excel sheets easier.

Anupam R.
Data Analyst
To the point topics
To-the-point topics and very needful for any professional working with Excel. I would recommend everyone to go through this course. Worth time spent on this course
Thanks, John. I thoroughly enjoyed your course. God bless!

Jaya M.
Inventory Specialist
Verified Certificate of Completion
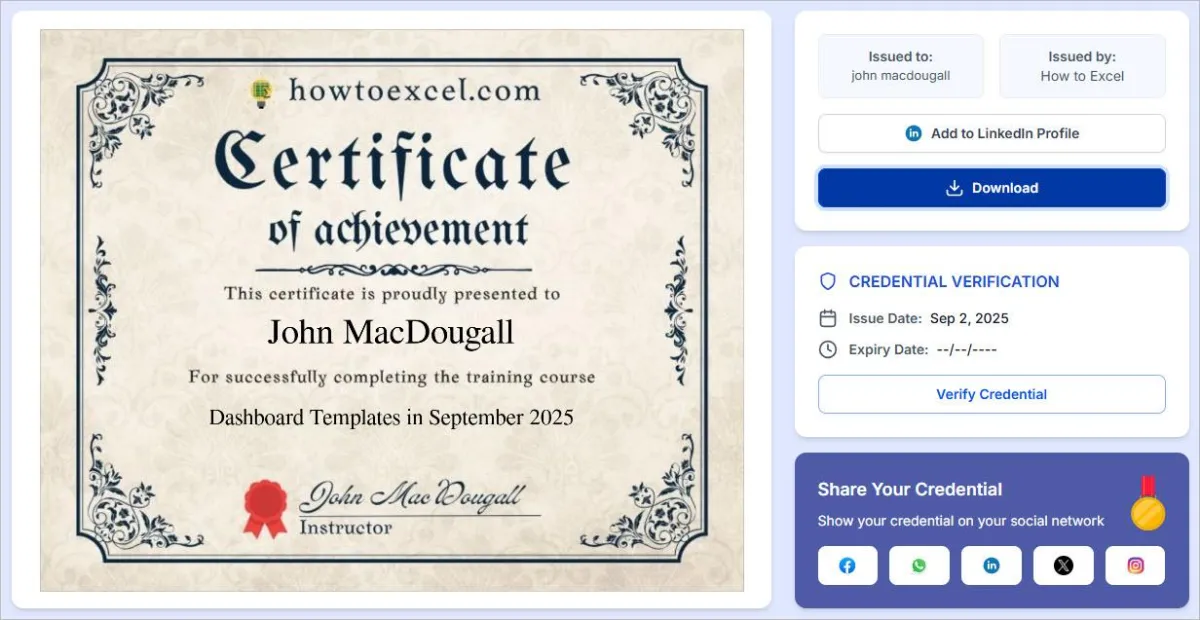
When you complete this training, you’ll earn a verified Certificate of Completion that proves your expertise.
Showcase your expertise with a verified certificate
Boost your professional profile by easily adding the certificate to your LinkedIn profile.
Share in one click on LinkedIn, Facebook, Instagram, and other social platforms.
It's easy to share, and shows employers that you have the Excel skills they need!
Frequently Asked Questions
❓ Where and when is the course?
This dashboard pack is a downloadable excercise and solution Excel workbook with clear instructions you can follow along with to build your own dashboards.
They can be done from the comfort of your own home or office at any time and at your own pace.
❓ What version of Excel is required for these dashboard pack?
The template files were created on a PC with Excel for Microsoft 365, but the majority of the features in the files will work with Excel 2016 or later.
❓Do you need any prior Excel knowledge?
These templates were designed with the beginners in mind and only require a basic knowledge of pivot tables.
❓ Is there a guarantee with the template pack?
All my courses come with a 30 day 100% money back guarantee. There's absolutely no risk!
If you aren’t completely satisfied for any reason just email me within 30 days of purchase and you will receive a full refund.
❓ How do I ask questions and get support?
Each file download has a discussion section so you can ask your question in the relevant lesson. You’ll be able to see questions and answers from other students there as well.
❓ How long do I have access to the template pack?
The dashboard template pack offers lifetime access, so you never have to worry about losing access to the content. You will continue to benefit from any future updates or new materials added to the template pack. Our goal is to ensure you stay current with the latest Excel features and best practices throughout your career.
Are You Ready to Transform Your Career?

Your career deserves the boost that advanced Excel mastery will bring. Take the next step toward unlocking your professional potential.
📢 Still thinking about it? Don’t wait! Enroll now and start transforming the way you work.